Automated analysis · v01 · 2026-08-11
Ohio Opioid Overdose Deaths: Statewide Trend, 2015–2026 (Provisional)
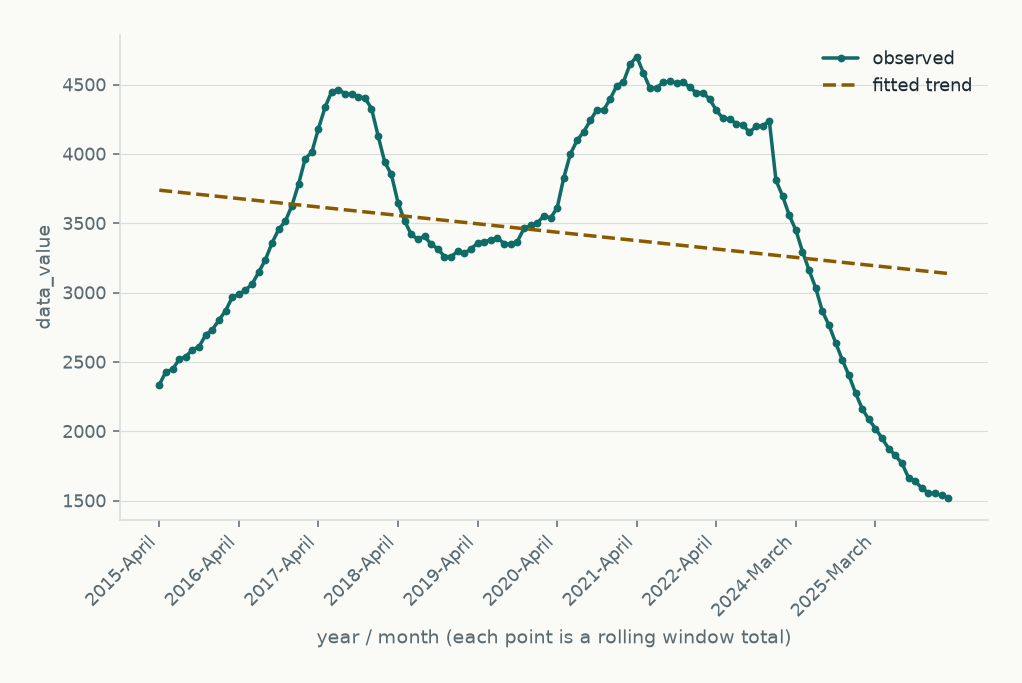
This automated analysis examines whether a rolling 12-month measure of opioid overdose deaths in Ohio has trended downward in recent years, using CDC provisional drug overdose surveillance data. Because the available dataset lacks a county identifier and a population denominator, the analysis could only address the statewide, unadjusted count trend rather than the age-adjusted, county-level rates the original question asked about. A linear trend fitted to the ordered rolling 12-month series for the overall opioid category (T40.0–T40.4, T40.6) showed a statistically significant downward slope over the analysed period, with the most recent rolling-window value substantially lower than the earliest one in the series. The decline is a smoothed, aggregate association over overlapping 12-month windows, not a year-by-year comparison, and recent points are based on provisional data subject to upward revision. County-level and fentanyl-specific breakdowns, and true age-adjusted rates, could not be produced from this data source.
Results
The analysed series ran from April 2015 (first value 2,335.0) to February 2026 (last value 1,522.0), covering 120 periods, with a minimum value of 1,522.0 and a maximum of 4,702.0 across the series. The absolute change from the first to the last period was -813.0, a percent change of about -34.82%. A linear trend fit to the ordered series produced a slope of -5.05 per period step (95% CI: -9.55 to -0.55), which was statistically significant (p = 0.028), though the model explained only a small share of the variation in the series (R-squared = 0.040). The fitted direction of the trend was classified as decreasing. No findings on individual counties or on fentanyl versus other opioid subtypes were produced, because the dataset used contains no county identifier and no drug-subtype breakdown suitable for that comparison.
Background
Opioid overdose mortality has been a persistent public health concern in Ohio and nationally. Tracking whether death counts are rising or falling, and whether any change is uniform across the state, matters for public health monitoring and resource planning. Prior surveillance has suggested that overdose trends can shift over multi-year periods and can differ across drug subtypes (e.g., synthetic opioids like fentanyl versus prescription opioids or heroin) and across geographic areas. This analysis was intended to test whether Ohio's age-adjusted opioid overdose death rates have declined since 2020, both statewide and by county, and whether fentanyl-involved deaths are driving any statewide pattern.
Methods
The analysis used CDC's provisional drug overdose surveillance dataset (data.cdc.gov, dataset xkb8-kh2a, vintage 2026-07-15), which the caller pinned in place of the age-adjusted opioid overdose deaths dataset originally hinted at. The dataset contains rolling 12-month-ending totals of overdose deaths reported for Ohio, broken out by drug indicator category, with no county column and no population denominator. From an input of 1,608 rows, the data were filtered to the indicator "Opioids (T40.0-T40.4,T40.6)" to isolate the overall opioid category from other drug-specific indicators (cocaine, methadone, etc.), leaving 134 of 1,608 rows. Three rows with no usable value (suppressed or missing) were excluded rather than imputed or treated as zero, and eleven rows with reporting completeness under 100% were excluded, leaving 120 rows analysed. The outcome variable was the raw rolling 12-month death count (data_value), ordered by year and month; a single linear trend line was fit to this ordered series to test for a directional change over time. The series spans from April 2015 through February 2026. Because each observation is a trailing 12-month total, values were analysed as levels over time and were never summed across rows.
Limitations
- This dataset (CDC VSRR provisional counts) contains no county column, so a county-by-county breakdown as asked in the original question could not be produced — only a single statewide Ohio series is available.
- The outcome measured is a raw death count, not an age-adjusted rate; no population denominator is present, so true age-adjusted rate comparisons over time are not possible with this data.
- Rows represent 12-month-ending rolling windows, so consecutive monthly points are highly autocorrelated and represent overlapping periods rather than independent annual observations; the fitted slope describes a smoothed multi-year trend, not year-to-year change.
- Recent periods are provisional (98–100% complete) and will likely be revised upward, which can distort the estimated trend at the most recent end of the series.
- This is an ecological, aggregate time-series design; it cannot establish causal drivers, such as specific policies or fentanyl-specific mechanisms, behind any observed trend.
- Percent-complete varies by row, and no explicit incomplete/partial flag column exists beyond the percentage field itself, so exclusion of partial reporting periods relied solely on that threshold.
- Three rows with suppressed or missing values were dropped rather than imputed, which may slightly affect the continuity of the series.
- This is an automated analysis, not a peer-reviewed study, and the results should be interpreted as descriptive association rather than confirmed causal or clinical evidence.
What the analysis excluded
- Restricted to indicator='Opioids (T40.0-T40.4,T40.6)' (Restrict to the overall opioid overdose death category rather than pooling with cocaine, methadone, or other drug-specific indicators); 134 of 1608 rows.
- 3 row(s) had no usable value (suppressed or missing) and were excluded from the analysis. They were not imputed or treated as zero.
- 11 row(s) with reporting under 100% complete were excluded.
- Series is rolling: each value is a trailing-window total. Values are analysed as levels over time and are never summed.
Conclusion
Over the period covered by this provisional statewide series, Ohio's rolling 12-month opioid overdose death count showed a statistically significant downward trend, with the most recent value notably lower than the earliest one in the series. This pattern is consistent with, but does not confirm, a genuine decline in opioid overdose mortality, since the measure is an unadjusted count over overlapping time windows rather than an age-adjusted rate, and recent provisional figures may be revised upward. The data used could not support the county-level or fentanyl-subtype comparisons originally requested, so no conclusions can be drawn here about geographic unevenness or which opioid subtype is driving the statewide pattern. Any statements about drivers, causes, or policy effects would go beyond what this ecological, aggregate analysis can support.